Risk & Safety
Crypto Funding Rates Explained: What 7 Years of Bitcoin Data Show Longs Really Pay
Bitcoin longs paid funding on 87% of days since 2019. We analysed 7,776 funding payments to show what funding really costs, and what hot funding signals.
In February 2021, a trader who held a 10x Bitcoin long for the whole month paid about 72% of their margin in funding. That is before a single rupee of price loss. In September 2026, the same position would have cost about 4.5%.
Funding is the fee almost every crypto futures trader pays and almost nobody checks. It does not appear as a trade. It does not show up in a chart. It quietly moves money from one side of the market to the other every few hours, and over weeks it can matter more than the trading fee.
So we asked three questions. How much do longs actually pay over time? Does a high funding rate warn you about anything? And what should a trader do differently because of it?
To answer them, we went through every funding payment on Binance's Bitcoin perpetual, the most traded crypto futures contract in the world: 7,776 payments from September 2019 to 14 October 2026, plus the same data for Ether, Solana, XRP and Dogecoin. The short version: funding is a real cost, leverage multiplies it, and a hot funding rate tells you more about turbulence than about direction.
What a funding rate actually is
A perpetual futures contract never expires, so there is no settlement date to pull its price back to the real price of the coin. Funding is the mechanism that does that job instead. (Our guide to crypto futures covers perpetuals, leverage and margin.)
Every few hours, usually every eight, traders on one side of the market pay traders on the other side:
- Positive funding: the perpetual trades above the coin's price because buyers are keener. Longs pay shorts.
- Negative funding: the perpetual trades below the coin's price because sellers are keener. Shorts pay longs.
- The exchange does not keep it. Funding passes between traders. Your exchange's trading fee is a separate charge.
Most large exchanges set a default rate of 0.01% every eight hours when the market is balanced. That sounds like nothing. It is about 0.03% a day, and roughly 11% a year.
The detail most traders miss
Funding is charged on the full value of your position, not on the margin you put up.
Say you post ₹10,000 of margin at 10x leverage. Your position is worth ₹1,00,000. At the default 0.01% every eight hours, you pay ₹10 per funding period, ₹30 a day, about ₹900 a month. That is 9% of your margin every month just to keep the position open, whatever the price does.
The higher the leverage, the bigger the position relative to your margin, and the bigger funding becomes as a share of the money you actually put in.
How much Bitcoin longs actually paid, year by year
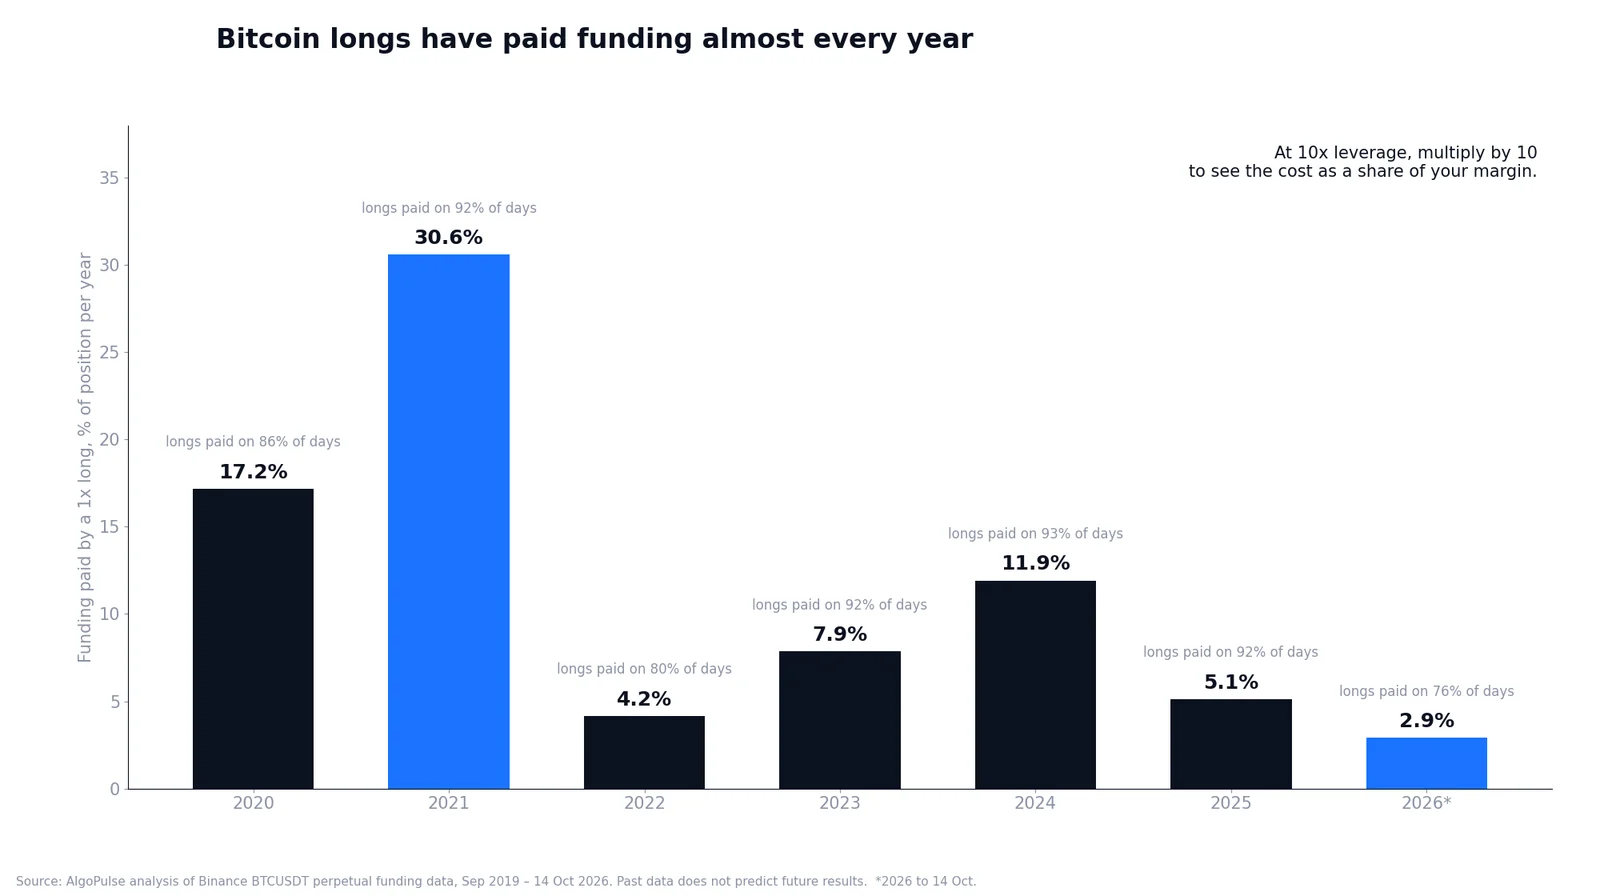
| Year | Funding paid by a 1x long (% of position per year) | Days on which longs paid |
|---|---|---|
| 2020 | 17.2% | 86% |
| 2021 | 30.6% | 92% |
| 2022 | 4.2% | 80% |
| 2023 | 7.9% | 92% |
| 2024 | 11.9% | 93% |
| 2025 | 5.1% | 92% |
| 2026 (to 14 Oct) | 2.9% | 76% |
Three things stand out.
Longs nearly always pay. Across seven years, funding was positive on 87% of days. Crypto traders lean long, and they pay for the privilege.
2021 was extraordinary. At the height of that bull run, holding a plain 1x Bitcoin long cost about 30% a year in funding. The single most expensive month, February 2021, cost 7.2% of the position in thirty days.
2026 is the calmest year on record. Funding has averaged 2.9% a year, and longs paid on only 76% of days, the lowest share in our data. Over the past twelve months, Bitcoin funding never once rose above the default 0.01% per eight hours. The market has not been crowded with eager leveraged buyers.
Leverage multiplies funding too
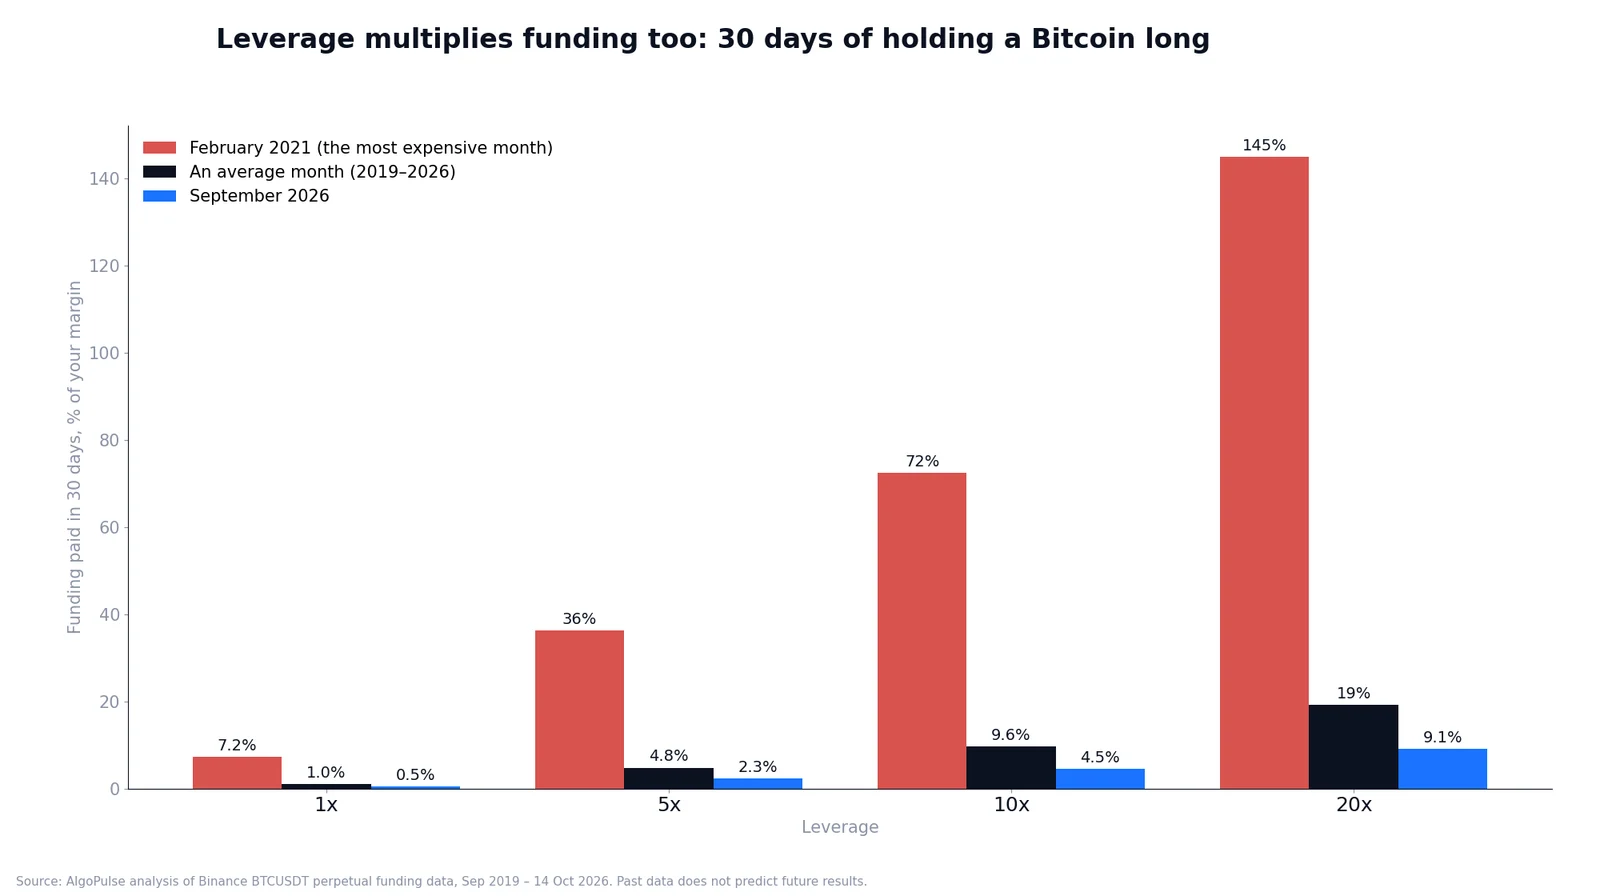
Here is what thirty days of holding a Bitcoin long cost, measured against your margin:
| Leverage | February 2021 | An average month (2019–2026) | September 2026 |
|---|---|---|---|
| 1x | 7.2% | 1.0% | 0.5% |
| 5x | 36% | 4.8% | 2.3% |
| 10x | 72% | 9.6% | 4.5% |
| 20x | 145% | 19% | 9.1% |
At 20x in February 2021, funding alone would have consumed more than the entire margin in a month. Even in an average month, a 10x long held throughout gave up nearly a tenth of its margin to funding.
This is why holding period matters so much. A trade that opens and closes within a few hours may pass through one funding time or none. A position held for weeks pays funding dozens of times, and at high leverage those small payments add up to a large share of your capital. Our guide to position sizing and leverage works through the rest of that maths.
Funding through booms and crashes
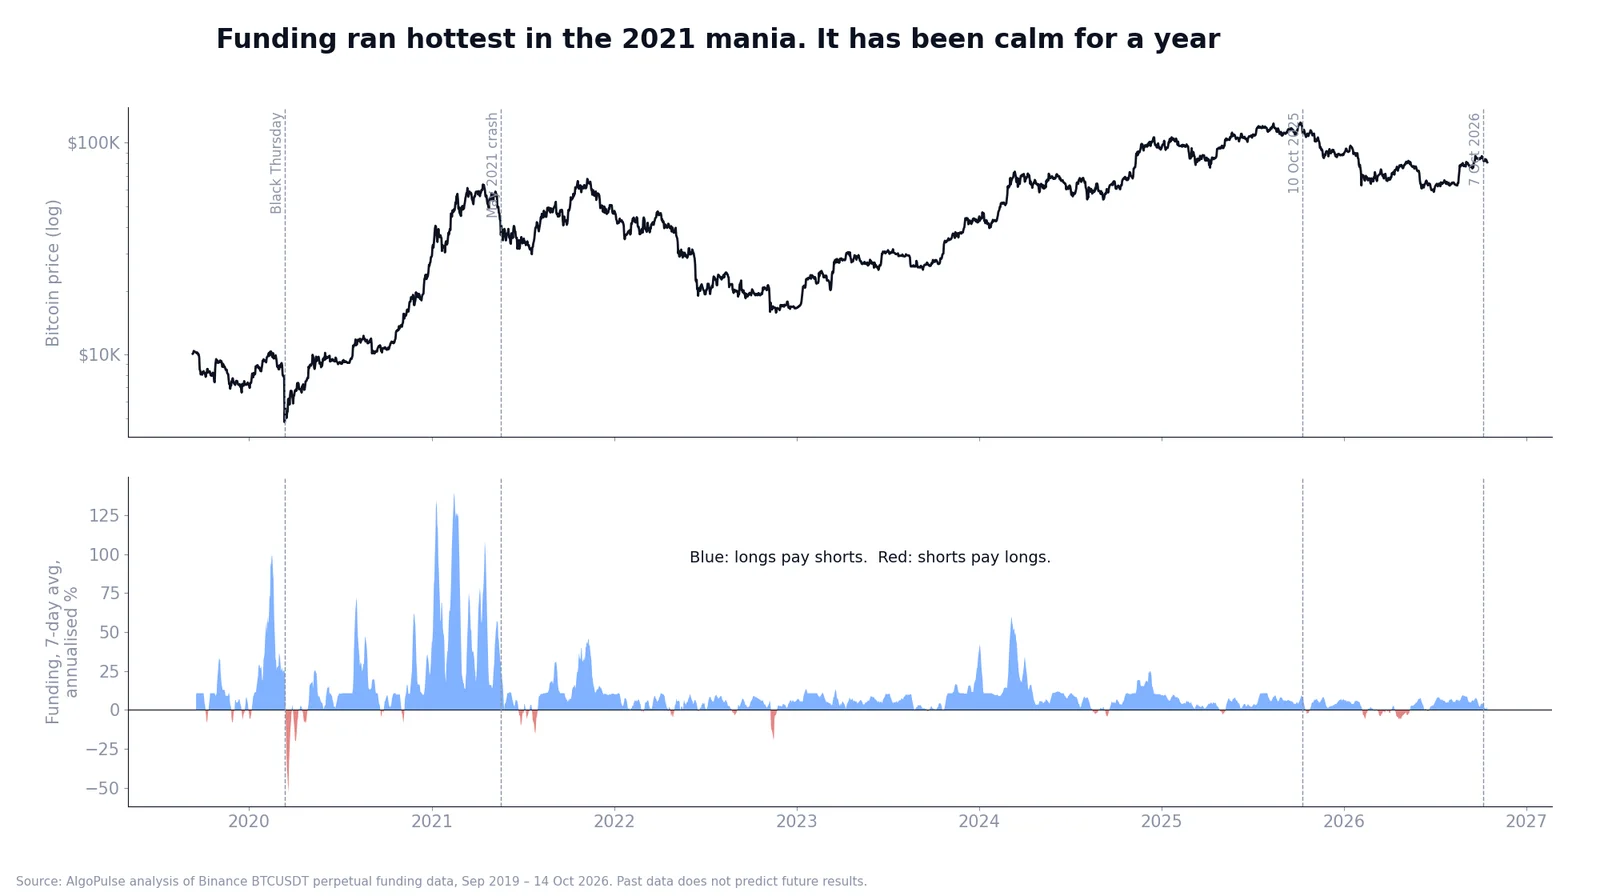
Put funding next to the price and a pattern appears. Funding runs hottest when excitement is highest: early 2020, the first half of 2021, early 2024. It turns negative after sharp falls, when traders rush to bet against the market and shorts end up paying longs.
Here is what funding looked like in the week before and the week after four big sell-offs:
| Event | Average daily funding, week before | Week after |
|---|---|---|
| 12 March 2020, Black Thursday | 0.069% (about 3x normal) | −0.144% (shorts paid) |
| 19 May 2021, China mining crackdown | 0.083% (about 3.5x normal) | 0.012% |
| 10 October 2025, the $19 billion day | 0.023% (exactly normal) | −0.002% |
| 7 October 2026 | 0.010% (below normal) | 0.005% |
The first two crashes came after weeks of expensive funding. Leverage was stacked up, and when the price slipped, it unwound violently.
The third is the important one. Before the largest liquidation day in crypto history, funding was completely ordinary. The trigger was an outside shock, a tariff announcement, and it hit a market that did not look crowded by this measure. Low funding is not a promise of safety.
Does hot funding predict anything?
We sorted every day since 2019 by its seven-day average funding rate and looked at what Bitcoin did over the following thirty days.
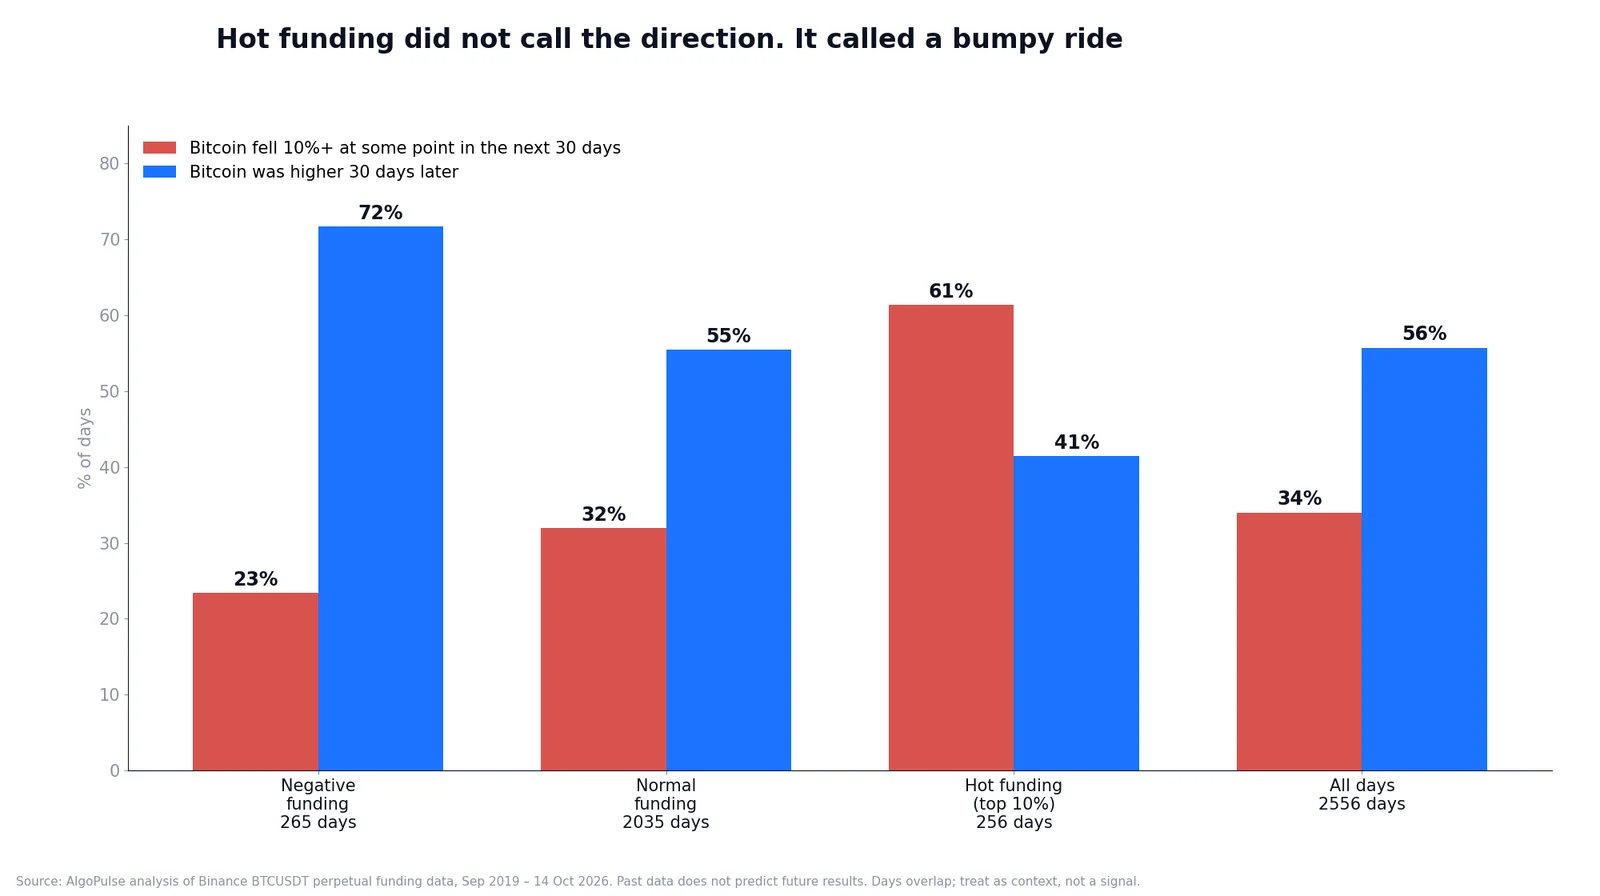
| Funding over the past week | Days | Bitcoin higher 30 days later | Median 30-day change | Fell 10% or more within 30 days |
|---|---|---|---|---|
| Negative (shorts paying) | 265 | 72% | +8.2% | 23% |
| Normal | 2,035 | 55% | +1.8% | 32% |
| Hot (top 10%, above about 28% a year) | 256 | 41% | −3.3% | 61% |
| All days | 2,556 | 56% | +2.1% | 34% |
Two readings, and one big caveat.
Hot funding came before turbulence. When funding was in its top 10%, Bitcoin dropped 10% or more at some point in the next month 61% of the time, nearly double the usual rate. Crowded leverage tends to get shaken out. But the direction was mixed: in the very hottest 5% of days, Bitcoin was actually higher a month later more often than not. Hot funding told you the ride would be bumpy, not which way it would end.
Negative funding came before better-than-average months. When shorts were paying, Bitcoin was higher thirty days later 72% of the time, against 56% on an average day. When most of the market is betting on a fall, there are fewer sellers left.
Not every coin behaves like Bitcoin
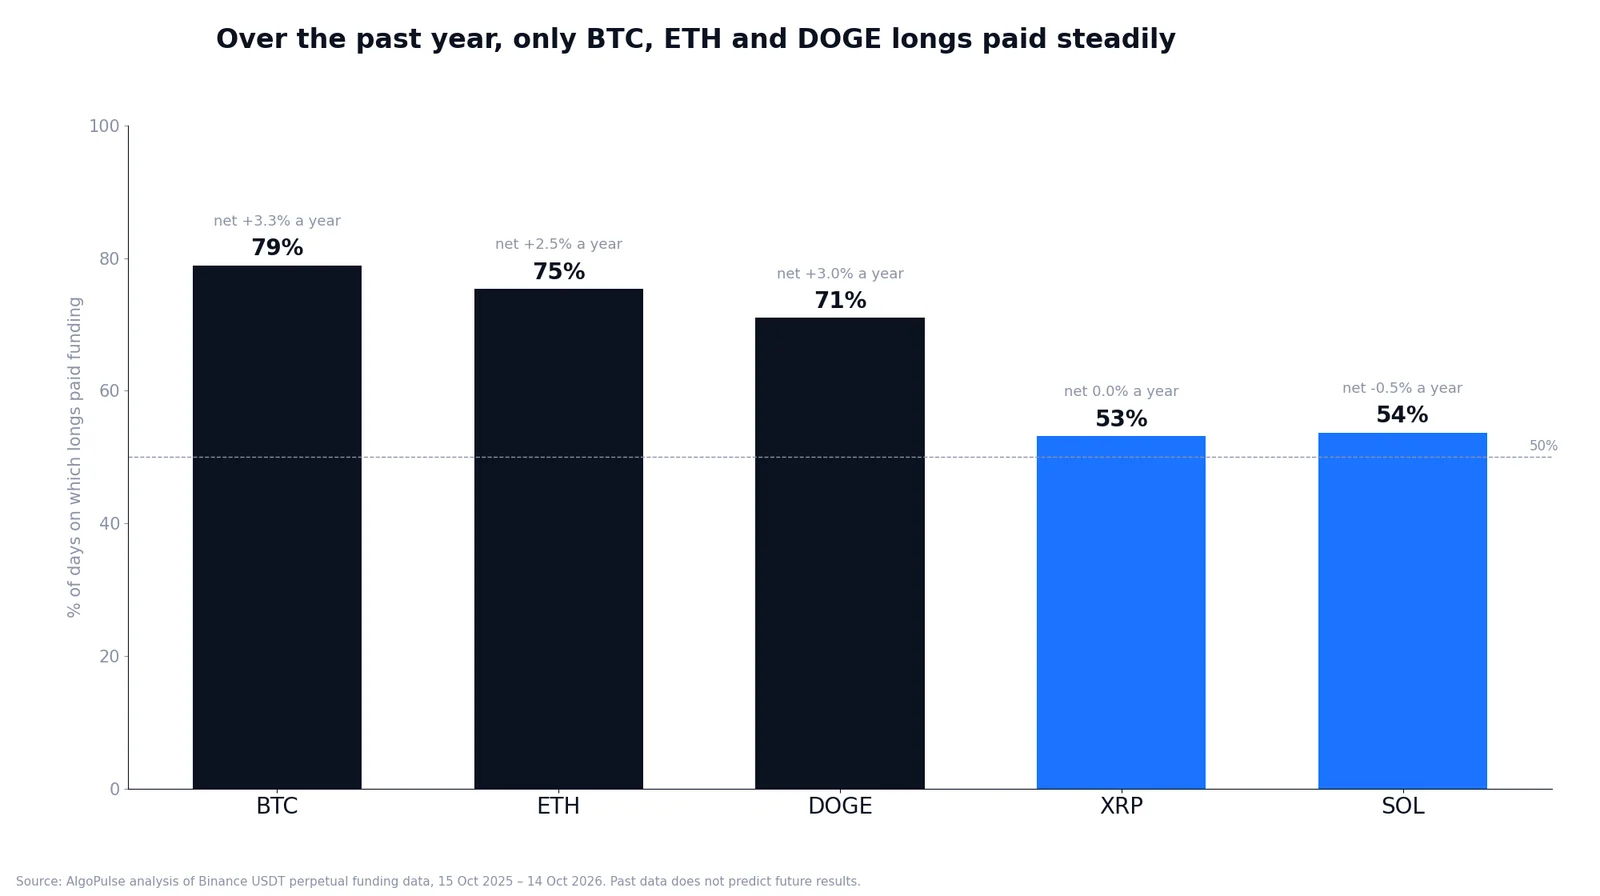
Over the past twelve months:
| Coin | Days on which longs paid | Net funding over the year |
|---|---|---|
| BTC | 79% | +3.3% |
| ETH | 75% | +2.5% |
| DOGE | 71% | +3.0% |
| XRP | 53% | about 0% |
| SOL | 54% | −0.5% |
On XRP and Solana, funding flipped back and forth so often that longs and shorts roughly broke even over the year.
Smaller coins can also swing to extremes that Bitcoin rarely reaches. During the FTX collapse on 9 November 2022, Solana's funding hit −2% for a single eight-hour period: shorts were paying 2% of their position three times a day to stay in the trade. In January and February 2021, at the peak of the retail frenzy, Dogecoin longs paid up to 0.38% in a single period.
The more speculative the coin, the more volatile its funding, and the more carefully a leveraged position on it needs watching. Our guide to Bitcoin and Ethereum algo trading covers why the majors behave differently.
Six funding mistakes traders make
1. Ignoring funding because each payment looks tiny
0.01% feels like a rounding error. Every eight hours, on the full position, for weeks, it is not. Work it out in rupees for your actual position size before you decide to hold.
2. Measuring funding against the position instead of the margin
A 10% yearly funding rate sounds modest. At 10x leverage it is 100% of your margin a year. Always convert funding into a share of the money you actually put in.
3. Holding high leverage for weeks
High leverage and long holding periods multiply each other. If a trade is meant to run for weeks, the funding bill is part of its cost, and lower leverage shrinks it.
4. Treating hot funding as a reason to short
Expensive funding means the market is crowded long. It does not mean the top is in. In 2021, funding stayed hot for months while the price kept rising, and shorts paid the whole way.
5. Treating negative funding as a free income trade
Getting paid to hold a long when funding is negative sounds attractive. But funding turns negative because the price has been falling and traders expect more. A 2% price drop wipes out months of funding income.
6. Assuming every exchange charges the same
Funding rates, intervals and caps differ by exchange and by contract. Indian exchanges such as Delta Exchange India, CoinDCX, Pi42, Shark Exchange and CoinSwitch PRO set funding on their own perpetuals. Rates tend to move with the global market but are not identical. Check the contract details on your exchange.
How different traders might think about funding
Intraday traders
Funding matters least to you, because short trades pass through few funding times. Know when your exchange's funding times are, and be aware that a trade left open across one of them pays or receives that period's funding.
Swing traders
Funding is a real cost for you. A position held for two weeks pays funding around forty times. Before entering, estimate the funding bill for your expected holding period and include it when you judge whether the trade is worth taking.
Leveraged long-term holders
If you are holding a leveraged long for months, compare the funding bill with simply buying the coin on spot. In years like 2021, the funding on a leveraged long cost more than the leverage was likely to earn you.
Systematic and algo traders
Look at how long a strategy usually holds its positions. A strategy that holds for days pays funding on every trade, and a backtest that leaves funding out will flatter it. Ask whether funding is included before you rely on the numbers. Our guide to reading a backtest report covers what else to check.
A funding checklist before your next futures trade
- I know the current funding rate on my exchange and when the next funding time is.
- I have worked out the funding cost in rupees for my expected holding period.
- I have compared that cost with my margin, not just my position size.
- My leverage makes sense for how long I plan to hold.
- I am not shorting only because funding is hot, or going long only because it is negative.
- I know whether my exchange settles funding in USDT, USD or INR.
How AlgoPulse thinks about funding
We do not treat funding as a trading signal on its own. Our data shows why: it was perfectly normal before the biggest crash on record.
We do treat it as a cost. Every AlgoPulse strategy is labelled Swing or Intraday so you know roughly how long it holds positions. That tells you how much funding is likely to matter before you deploy. Strategies run on our servers through a trade-only API key, so they pass through funding times while you sleep, and your funds never leave your own exchange account.
Questions people ask
What is a funding rate in crypto?
A periodic payment between traders on a perpetual futures contract. When it is positive, longs pay shorts. When it is negative, shorts pay longs. It keeps the perpetual's price close to the coin's real price.
How often is funding charged?
Usually every eight hours, three times a day, though some exchanges and contracts use shorter intervals. You only pay or receive it if your position is open at the funding time.
Who receives the funding fee? The exchange?
No. Funding passes between traders on opposite sides. The exchange earns its trading fee separately.
What does a negative funding rate mean?
Shorts are paying longs, usually because traders are betting heavily on a fall. In our data, Bitcoin was higher thirty days after negative-funding weeks more often than average, but the sample is small.
How do I calculate funding on my position?
Multiply your position's full value by the funding rate. A ₹1,00,000 position at 0.01% pays ₹10 per funding period. At 10x leverage, that ₹1,00,000 position needs only ₹10,000 of margin, so the funding is a ten-times-larger share of your money.
Is funding a reason to avoid futures?
Not on its own. It is a cost to plan for, like a trading fee. It matters most for leveraged positions held for a long time.
Methodology: funding data is Binance USDT-margined perpetual funding history, downloaded from Binance's public API. Daily funding is the sum of all funding payments in a UTC day. Bitcoin data runs from 10 September 2019 to 14 October 2026 (7,776 funding payments). "Hot" means a seven-day average funding rate in the top 10% of all days. Forward returns use Binance BTCUSDT daily closing prices. Thirty-day windows overlap, so results are not independent observations.
This article is for education only and is not financial advice. Crypto futures trading involves substantial risk, including the loss of your entire margin. Past data does not predict future results.
Ready to try it yourself?
AlgoPulse is free — no card, no subscription. Connect your broker and deploy a strategy in about 5 minutes.
Start free